
Our Standard Deviation Calculator offers a simple yet powerful tool to compute standard deviation in two scenarios: with and without probabilities. Whether you’re analyzing data with known probability distributions or working with a set of raw values, this calculator provides accurate results for both. Use it to easily calculate the dispersion of your dataset, helping you gain deeper insights into variability and risk assessment.
Standard Deviation Calculators
Standard Deviation Calculator (With Probabilities)
Project 1
Result
You can also calculate the standard deviation with just your expected returns from a distribution. We use the formula, √Σ[Ri-E(Ri)]²/N – 1 to calculate it without probabilities. To do this, enter the expected returns from your project and hit the “Calculate” button.
Standard Deviation Calculator (Without Probabilities)
Project 1
Result
Tips to get better output:
- You can calculate the standard deviation for each of your projects separately.
- Enter a project name for your understanding.
- Enter the returns (Ri) and probabilities (if applicable) for each project.
- You can add more fields or remove them if needed.
- Hit the “Calculate” button to see the result or “Reset” if it goes wrong.
- Please don’t leave a field blank, remove it instead.
What is the Standard Deviation in Finance?
In finance, we use the standard deviation to measure the amount of variation or dispersion of a set of financial data points, such as returns on an investment. It indicates how much the return of an asset or portfolio fluctuates around the mean or average return.
In the context of portfolio management and risk assessment, standard deviation is used to evaluate the risk of individual investments or entire portfolios, helping investors understand the potential ups and downs of their investments.
What is the Standard Deviation Calculator?
This is our specialized web tool to calculate the standard deviation using your data set or distribution in a second. This is a completely free tool. This calculator was created based on the formula for standard deviation in finance. See the formulas we used behind this calculator.
Formula For Standard Deviation in Finance
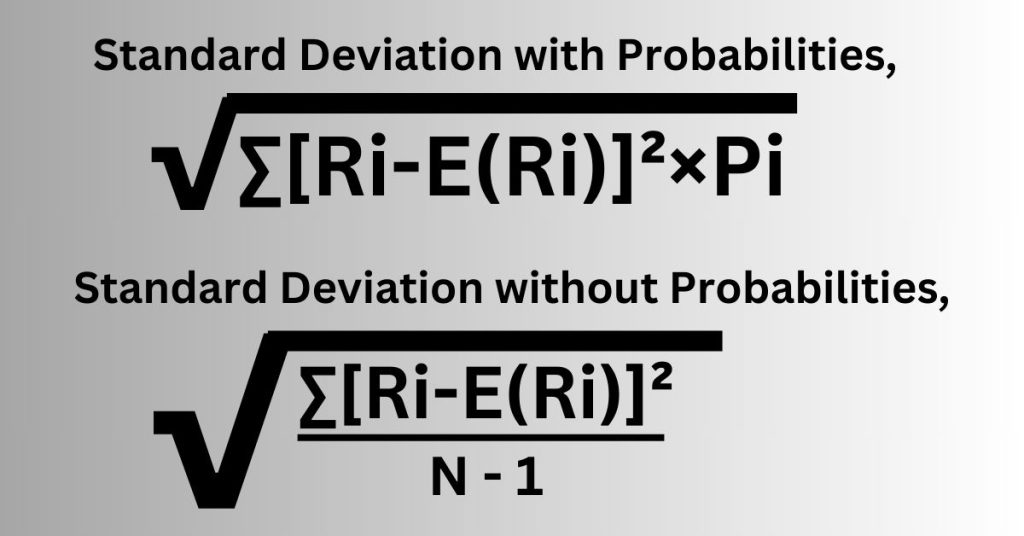
Here,
- Ri = Expected returns
- E(Ri) = Average expected returns
- Pi = Probabilities
- N = Total count of the number in the distribution
What does mean a Lower Standard Deviation?
A lower standard deviation indicates that returns are closer to the mean, suggesting lower risk and more stability. So it’s great if you have a lower standard deviation.
In other terms, The investment’s performance is more stable and predictable, as it tends to have smaller fluctuations in returns over time. It tells that your asset’s returns do not differ much from the expected average return, which suggests that the investment is less volatile.
What does mean a Higher Standard Deviation?
A higher standard deviation signifies more volatility, which means more risk. In other words, the returns (profits or losses) on the investment vary significantly over time. Instead of consistently generating returns close to an average value, the investment may experience larger fluctuations—sometimes gaining a lot, other times losing significantly.
For Example:
- If an investment has an average return of 6%, but in some years returns 20% and in others -3%, the returns are spread out over a wide range. This signifies higher volatility and risk because the outcomes are less predictable.
- Conversely, if another investment has an average return of 7% but its yearly returns fluctuate between 6% and 8%, the returns are less spread out, indicating more stability and less risk.
In other words, a higher standard deviation means that the investment experiences more extreme ups and downs, which can make the future performance of your project less certain.
Please note that this content does not provide you with any financial advice. Investing in a project or not is your own choice. This is only for your help and we will be glad to know any helpful ideas or recommendations from you.