
The Portfolio Standard Deviation Calculator is an essential tool for investors looking to measure their portfolio’s overall risk based on the individual risks of its assets. Unlike simple standard deviation, which assesses the volatility of particular securities, portfolio standard deviation considers how different assets interact, giving a more accurate view of your portfolio’s total risk.
| Assets/Securities | Investments | Standard Deviations (σ) |
|---|---|---|
Portfolio Standard Deviation (σp): %
What is the Portfolio Standard Deviation Calculator?
If you’re already familiar with our Standard Deviation Calculator, which calculates the risk of a single asset, this Portfolio Standard Deviation Calculator takes it further by assessing multiple assets. By factoring in the individual standard deviations of your assets, the weight of each investment, and the correlation between assets, this tool helps you better understand how diversification impacts your portfolio’s risk.
How to Use the Portfolio Standard Deviation Calculator
Our Portfolio Standard Deviation Calculator is very easy to use:
- Input Asset Data: Enter the name, investment amount, and standard deviation for two assets in your portfolio.
- Specify the Correlation: Provide the correlation coefficient between the two assets. This value can range from -1 to 1, where:
- 1 represents a perfect positive correlation (assets move the same).
- -1 represents a complete negative correlation (where an asset moves in the opposite direction of another).
- 0 represents no correlation between the assets(the assets may move independently).
- Click Calculate: With a button click, the calculator instantly computes the overall portfolio standard deviation using the formula specified below.
- Get Your Results: The portfolio standard deviation will appear below the calculator, giving you an immediate understanding of the total risk.
Why is Portfolio Standard Deviation Important?
Portfolio standard deviation helps you see the bigger image between your two assets by combining the individual risks of each asset and the way they move together. If you hold less correlated (or negatively correlated) assets, you can reduce your portfolio’s total risk without sacrificing returns.
By using the Portfolio Standard Deviation Calculator, you can:
- Evaluate Risk: Understand the total risk your portfolio faces, allowing you to make more informed investment decisions.
- Optimize Asset Allocation: Adjust the weight of each asset to minimize risk while maximizing returns.
- Measure Diversification: Ensure your portfolio is well-diversified and that you’re not overly exposed to any single asset or correlated group of assets.
Take Control of Your Portfolio’s Risk
Investing wisely means more than just picking high-performing stocks; it’s about managing risk effectively. By calculating your portfolio’s standard deviation, you can optimize your investment strategy for both risk and return. Whether you’re new to investing or an experienced portfolio manager, this tool can help you strike the right balance.
The formula for Portfolio Standard Deviation
This formula is different than the formula for calculating the standard deviation for an individual security. Look at the formula below:
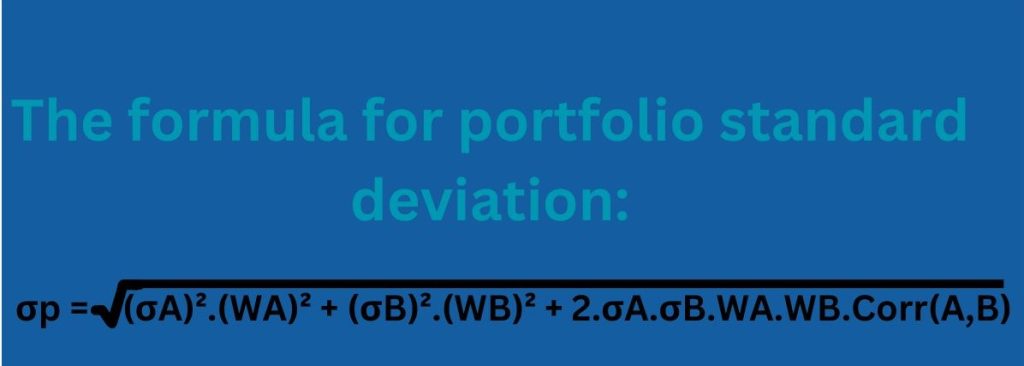
Where,
- σp = Portfolio standard deviation
- σA = Standard deviation for asset A
- σB = Standard deviation for asset B
- WA = Weight for asset A
- WB = Weight for asset B
- CORR(A,B) = The correlation between two assets/securities
What is Correlation (r) in Finance?
Correlation is a statistical measure that describes the relationship between two assets and how they move concerning each other. In portfolio management, correlation helps us determine the risk and return of a portfolio as it affects the level of diversification.
The correlation coefficient, typically represented by the symbol r or Corr(A,B), can range from -1 to 1.
Correlation Coefficient Explained:
- Positive Correlation (+1):
- r = +1 indicates a perfect positive correlation. This means the two assets move in the same direction at the same rate. If Asset A goes up by 5%, Asset B also goes up by 5%.
- Example: Two stocks in the same industry often exhibit positive correlations because they are influenced by similar factors (e.g., Apple and Microsoft in the tech sector).
- Negative Correlation (-1):
- r = -1 shows a total negative correlation. This means that the two assets move in opposite directions. When Asset A goes up, Asset B goes down by an equal amount.
- Example: Stocks and government bonds often have a negative correlation, especially during economic downturns when stocks might fall while bonds increase in value as investors seek safety.
- No Correlation (0):
- r = 0 indicates no correlation. The movements of the two assets are completely independent of each other. When one asset’s price changes, there’s no predictable effect on the other.
- Example: A stock and a commodity, like gold, may exhibit little to no correlation because their prices are driven by entirely different market forces.
A Real-World Example of Correlation
Suppose you have two assets:
- Asset A: A stock in a tech company.
- Asset B: A bond.
If these two assets have a negative correlation (e.g., -0.3), it means that when the tech stock drops due to market volatility, the bond might increase in value as investors seek safer investments. This relationship helps stabilize your portfolio, balancing out risks.