
The Coefficient of Variation (CV) Calculator is a versatile tool designed to help users measure the relative variability of data sets. Whether you’re analyzing financial returns, statistical data, or any other quantitative information, this calculator provides a clear and simple way to calculate the coefficient of variation with mean and standard deviation in seconds.
Before calculating the coefficient of variation you need to calculate the standard deviation and mean or expected return.
What is the coefficient of variation in Finance?
In finance, the covariance is associated with analyzing financial returns (for example, to understand how two stocks move together). We calculate this by dividing the standard deviation by the mean or expected return of returns of an investment project.
The coefficient of variation helps investors evaluate the risk per unit of return. A lower CV indicates that the investment offers higher returns relative to the risk, while a higher CV suggests more volatility relative to the expected return, making the investment riskier. This makes it a beneficial formula in finance for comparing two or more investment options.
Example of Coefficient of Variation
Suppose you are comparing two investment options:
- Investment A:
- Standard Deviation (σ): 8%
- Expected Return E{(R)}: 12%
- Investment B:
- Expected Return {E(R)}: 10%
- Standard Deviation (σ): 5%
So the CV of these two investment projects will be:
CV of Investment A: 0.08/0.12 * 100 = 66.67%
CV of Investment B: 0.05/0.10 * 100 = 50.00%
How to make decisions with the coefficient of variation (CV)?
- Investment A has a coefficient of variation of 66.67%, meaning for every unit of return (100%), there are 66.67% units of risk (volatility).
- Investment B has a coefficient of variation of 50.00%, meaning for every unit of return (100%), there are only 50.00% units of risk.
Decision:
- Although Investment A has a higher expected return (12%) compared to Investment B (10%), its CV of 66.67% suggests that it comes with more risk relative to the return.
- On the other hand, Investment B offers a lower expected return but a more favorable CV of 50.00%, indicating it has a lower relative risk.
The Formula we’ve used in this Coefficient of Variation Calculator is:
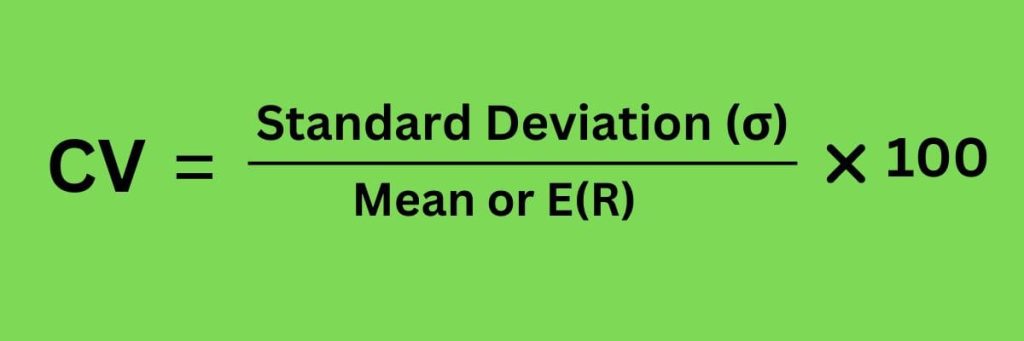
Standard Deviation (SD or σ)
Standard Deviation (SD) Measures the volatility or risk of the asset’s returns. In other words, it determines how much of an asset’s return can fluctuate from its average return. A higher standard deviation indicates more risk, while a lower standard deviation suggests a more stable return and less risk.
Standard deviation is one of the most commonly used metrics to assess the risk of an investment. Investors often use standard deviation when making a diversified portfolio. Along with expected return, standard deviation helps in comparing investments. For example, two investments might have the same expected return, but the one with the lower standard deviation is generally considered less risky.
In finance, if a stock has an expected return of 8% with a standard deviation of 5%, this means that, on average, the stock’s return can fluctuate by 5 percentage points above or below the expected return. So, one can expect the return to typically fall within the range of 3% to 13%, assuming a normal distribution of returns.
Mean or Expected Return
Expected Return or the mean of the return refers to the average return you expect from the project over a given period, based on historical data or probabilistic estimates. It provides a measure of what an investor might reasonably expect to earn on average from his investment.
We can calculate the expected return using the formula of simple arithmetic mean, in the case of we use historical returns. But if we use the probabilistic return the formula for the expected return is, ΣRi×Pi. Where we multiply each of the returns by its probability and then sum the results.
Remember that, the expected return is essentially the average of all possible outcomes, helping investors gauge the long-term profitability of an investment. It does not guarantee the actual return in any given period but reflects the average return that one could expect over time.
Disclaimer: This coefficient of variation calculator does not provide you with any financial advice. Investing in a project or not will be only at your own risk. This content is only for informational and learning purposes.